Next: Yahoo! News Data-set
Up: Data-sets
Previous: Pen Digits Data-set
Contents
Drugstore Data-set
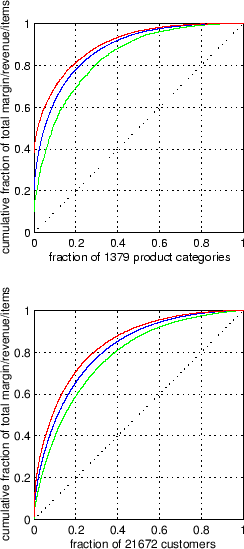
Figure A.6:
Drugstore data before preprocessing.
Distribution of profit margin (red, highest), revenue (blue, between), item count (green, lowest), and profit margin (red) for
21672 active customers and 1379 purchased product categories.
Sorted by revenue per product (top) and per customer (bottom).
Total revenue on 543,744 items sold is $1,974,824.52 and total
profit margin is $908,302.88.
|
|
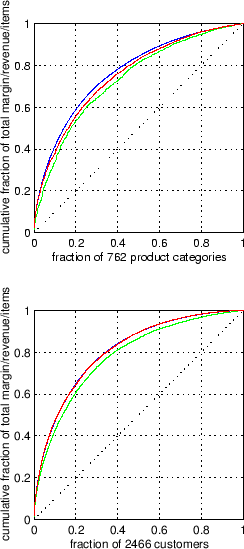
Figure A.7:
Drugstore data sample RETAIL. Margin/revenue/item count
distribution for 762 selected product categories (top) and 2466 sampled customers (bottom).
Total revenue on 38,816 items sold is $126,899.03 and total profit is $45,151.18.
|
|
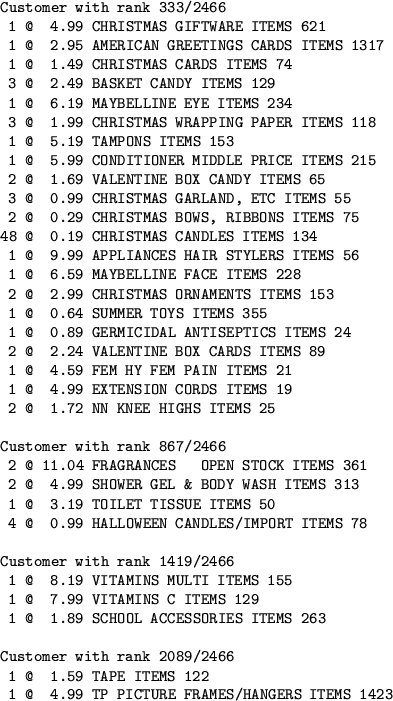
Table A.1:
Exemplary market-baskets from drugstore data-set RETAIL.
 |
Alexander Strehl
2002-05-03