


Next: Visualization
Up: CLUSION: Cluster Visualization
Previous: CLUSION: Cluster Visualization
Contents
When data is limited to 2 or 3 dimensions, the most powerful tool for
judging cluster quality is usually the human eye. CLUSION,
our CLUSter visualizatION toolkit, allows us to convert
high-dimensional data into a perceptually more suitable format, and
employ the human vision system to explore the relationships in
the data, guide the clustering process, and verify the
quality of the results. In our experience with two years of Dell
customer data, we found CLUSION effective for getting
clusters balanced w.r.t. number of customers or net dollar ($)
amount, and even more so for conveying the results to marketing
management.
CLUSION looks at the output of a clustering routine,
reorders the data points such that points with the same cluster label
are contiguous, and then visualizes the resulting permuted similarity
matrix,
 . More formally, the original
 similarity matrix
 is permuted with a
permutation matrix
is permuted with a
permutation matrix
 which is defined as follows:
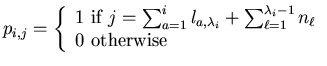 |
(3.6) |
 are entries in the binary
 cluster membership
indicator matrix
cluster membership
indicator matrix
 :
:
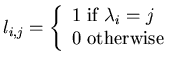 |
(3.7) |
In other words,  is 1 if
  is the sum of the number of
points amongst the first
is the sum of the number of
points amongst the first  that belong to the same cluster and the
number of points in the first
that belong to the same cluster and the
number of points in the first
 clusters.
Now, the permuted similarity matrix
and the
corresponding label vector
clusters.
Now, the permuted similarity matrix
and the
corresponding label vector
 and data matrix
 are:
are:
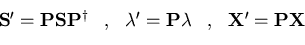 |
(3.8) |
For a `good' clustering algorithm and
 this is
related to sparse matrix reordering, for this results in the
generation of a `banded matrix' where high entries should all fall
near the diagonal line from the upper left to the lower right of the
matrix. Since equation 3.8 is essentially a partial
ordering operation we also refer to it as coarse seriation, a
phrase used in disciplines such as anthropology and archaeology to
describe the reordering of the primary data matrix so that similar
structures (e.g., genetic sequences) are brought closer
[Mur85,ESBB98].
this is
related to sparse matrix reordering, for this results in the
generation of a `banded matrix' where high entries should all fall
near the diagonal line from the upper left to the lower right of the
matrix. Since equation 3.8 is essentially a partial
ordering operation we also refer to it as coarse seriation, a
phrase used in disciplines such as anthropology and archaeology to
describe the reordering of the primary data matrix so that similar
structures (e.g., genetic sequences) are brought closer
[Mur85,ESBB98].
Next: Visualization
Up: CLUSION: Cluster Visualization
Previous: CLUSION: Cluster Visualization
Contents
Alexander Strehl
2002-05-03