


Next: System Issues
Up: Experiments
Previous: Web-document Clusters
Contents
Web-log Session Clusters
Web-portals and other e-commerce sites often segment their visitors to
provide better personalized services. When a web-page is requested,
the server log records the user's IP address, the URL retrieved,
access time, etc. These logs can be analyzed to segment visitors based
on their `cow-path' or trajectory through the website, as described
by the sequence of pages visited, page contents, time spent on each
page, etc.
In a recent work, the use of a weighted Longest Common
Subsequence (LCS) [BG01] similarity metric to describe how
similar two trajectories are was suggested. This metric determines the LCS of the
two trajectories, and then scales it by what fraction of the total
visit time is spent in the longest common subsequence. Alternatively,
one can use a vector-space model, wherein entries in the data matrix
 indicate time spent in a particular session (column) on a
particular page (row).
In this subsection, we present results of OPOSSUM and
CLUSION for the data presented in [BG01]. We
randomly selected 3000 sessions (out of 23310) from a community
portal, http://www.sulekha.com/. The index / root page of the web-portal
was removed since it was visited by almost everyone for a considerable
amount of time and, hence, provided no discriminatory information.
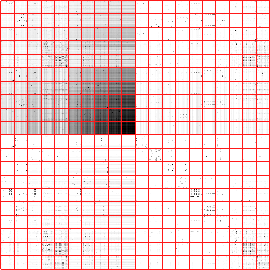
Figure 3.7 compares results for a
vector-space-based approach using cosine similarity with LCS.
The cosine measure shows some large dark diagonal regions indicating
compact clusters of sessions, but it turns out that these clusters are
sessions where the majority of the time was spent on a category index
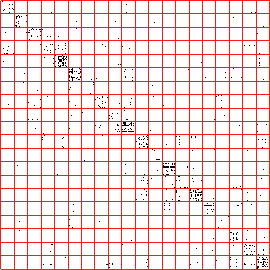
page (level 2 on the portal's site map). The LCS is able to capture a
larger percentage of the total similarity (amount of `grayness') in
the diagonal regions, showing a better and more balanced grouping.
Such visualization can be used to select the appropriate similarity
measure for a given clustering objective, and to evaluate the overall
clustering quality. For example, CLUSION shows that
clustering visitors into 20 groups was successful despite the extreme
sparsity (
indicate time spent in a particular session (column) on a
particular page (row).
In this subsection, we present results of OPOSSUM and
CLUSION for the data presented in [BG01]. We
randomly selected 3000 sessions (out of 23310) from a community
portal, http://www.sulekha.com/. The index / root page of the web-portal
was removed since it was visited by almost everyone for a considerable
amount of time and, hence, provided no discriminatory information.
Figure 3.7 compares results for a
vector-space-based approach using cosine similarity with LCS.
The cosine measure shows some large dark diagonal regions indicating
compact clusters of sessions, but it turns out that these clusters are
sessions where the majority of the time was spent on a category index
page (level 2 on the portal's site map). The LCS is able to capture a
larger percentage of the total similarity (amount of `grayness') in
the diagonal regions, showing a better and more balanced grouping.
Such visualization can be used to select the appropriate similarity
measure for a given clustering objective, and to evaluate the overall
clustering quality. For example, CLUSION shows that
clustering visitors into 20 groups was successful despite the extreme
sparsity ( 1%) in figure 3.7(b).
Figure 3.7:
Web-log session clustering using a vector space model
and cosine similarity (a) versus using weighted longest common
sub-sequence similarity (b). The cosine similarity is far less sparse
and is dominated by major category index pages, while the LCS shows better
isolation among the clusters.
 |
 |
| (a) |
(b) |
|
We also used value-balanced OPOSSUM to cluster web-log
sessions which yields clusters with comparable total web-surfer
exposure time. These clusters might be particularly useful for new
formats in target advertising campaigns. It simplifies advertising
campaign management by enabling the portal to offer fixed prizes for
ad delivery exposure to each cluster since they represent comparable
attention times.
Next: System Issues
Up: Experiments
Previous: Web-document Clusters
Contents
Alexander Strehl
2002-05-03